Mark Pincher analyses income share, patterns and trends on regular giving data, drawn from CharityFinancials.com
One of the more popular forms of giving used by today’s society is direct debit, which enables busy individuals to give a little each month without thinking about it. It’s also an effective way to offer longer term support to a worthwhile cause that is specifically chosen by the individual. Now that some charities* are beginning to report the amounts donated by regular giving in their annual financial statements, we are able to identify the levels of contribution they make to total voluntary income, and in some cases their values are startling. In such cases, regular giving provides some of the UK’s largest charities with the finance to execute their charitable objects.

Income share
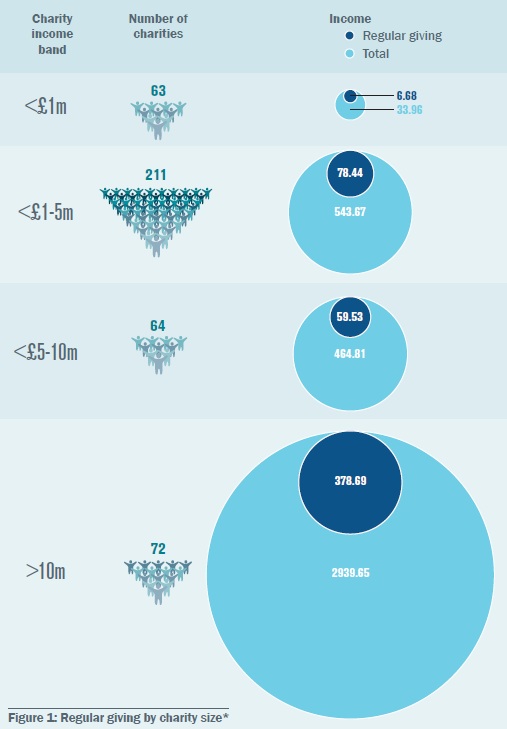
Regular giving has become extremely popular with donors. According to CharityFinancials.com 415 charities from the top 5,000 charities reported receiving regular giving income valued at £523.34m in 2009/10. For this set of organisations regular giving represented 29.1 per cent of voluntary income and 13.1 per cent of total income. At an individual charity level, the proportion of regular giving income as a percentage of total income varied considerably but those organisations that obtained the majority of their total income from this source were easily identifiable. For example, ActionAid receives 58.9 per cent of its total income from regular giving, valued at £38.09m. The National Deaf Children’s Society received £12.84m, which accounted for 78.4 per cent of its £16.38m revenue. The NSPCC obtained the most from regular giving, receiving £70.1m, which accounted for 46.1 per cent of its total income and the equivalent of £5.84m per month.
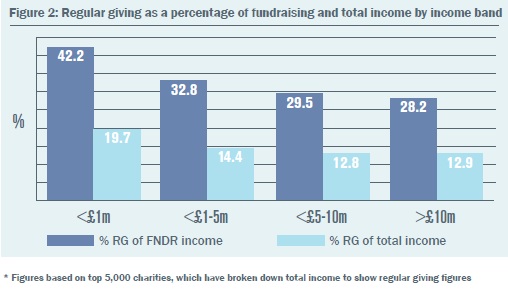
The proportion of regular giving income by income band shows similar results to our previous special focus on events income (see Issue 1, January 2011). The larger charities receive a greater value of regular giving (12.9 per cent of total revenue) but for smaller charities its contribution is a larger proportion of total income, representing 19.7 per cent. It is therefore more important for these smaller organisations to protect and develop current levels of regular giving to ensure present and future levels of outputs relating to their charitable activities.

Recent patterns and trends
Of the 415 organisations that were identified as reporting levels of regular giving income, 307 received funds from this source over four consecutive years between 2006/07 and 2009/10. The growth trend over the period for these charities demonstrates that income from regular giving is increasing year on year, from £245.17 in 2006/07 to £296.24 in 2009/10 – a growth of 20.8 per cent over the period. However, although year on year regular giving income has increased, the growth rate is slowing. Between 2006/07 and 2007/08, income grew by 15.4 per cent from £245.17m to £282.94m. However, in 2008/09 growth reduced to 2.6 per cent and in 2009/10 it fell again to 2.0 per cent. This can be attributed to changing personal circumstances among supporters in light of the economic situation, resulting in some cancellations or reductions in value of direct debits. Alternatively, the process of donor acquisition has become that much harder due to the financial environment. The data suggests that increasing revenue from this source is going to be harder than it was before the economic downturn.
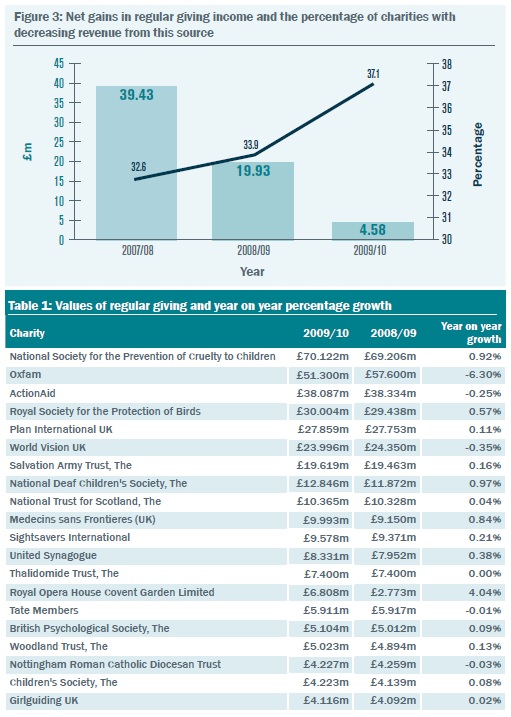
Figure 3 illustrates this by showing the percentage of organisations that witnessed a decrease in regular giving revenue. In 2007/08, the percentage of charities which saw a decrease was recorded as 32.6 per cent and for the same group of charities it increased to 33.9 per cent. It rose again to 37.1 per cent in 2009/10. For the same group of charities the net gain of regular giving income, where the gains are measured against the losses, also demonstrated how growth is reducing, with a net increase of £39.427m in 2007/08 decreasing to £19.931m in 2008/09, then falling to a mere £4.584m in 2009/10.
These trends put those charities which have high proportions of their total income from this source in a dilemma, whereby their future activities may need to be addressed due to compromised resources in extreme cases. Charities are often protected by such situations by diversifying their revenue streams, so that falls in one form of income can be plugged by increases in another. Fortunately the trend is of slowing growth rather than decreasing revenue at an aggregate level for regular giving. But as mentioned above, 37.1 per cent of charities which annually receive this income have seen levels decrease in the last year prompting them to comment in their annual reports. Oxfam stated that “income from regular giving fell by 3 per cent highlighting the difficult economic climate experienced over the last year”. ActionAid highlighted that “in 2008 we saw a decline in committed giving supporters after years of consistent growth and unfortunately this continued in 2009”. It reported a fall of 11,000 supporters, which can be largely attributed to financial concerns. However it only reported a decrease in revenue of less than 1 per cent, due to many supporters increasing their gift. World Vision stated that “the difficult economic climate resulted in committed giving and other donations decreasing by 6.6 per cent.”
Other charities have made gains in this area as Table 1 shows, although the majority of the time they are minimal. Regular giving is important to charities as committed supporters can be relied upon for regular and stable financial contributions. This relationship gives charities the opportunity to forecast revenue and therefore plan their future charitable activities. The fact that people have been forced to cancel direct debits due to financial difficulties is unfortunate. On a positive note, in such times of hardship, it gives others that can afford to do so the opportunity to give more, as evidenced by the recent Comic Relief television campaign.

Mark Pincher is product development manager at Caritas Data
This article first appeared in The Fundraiser magazine, Issue 4, April 2011


